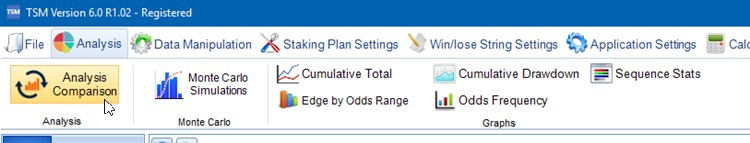
Analysis Comparison
Access Analysis Comparison through the Analysis Tab.
The Analysis Comparison Screen compares all Staking Plans results against each other.
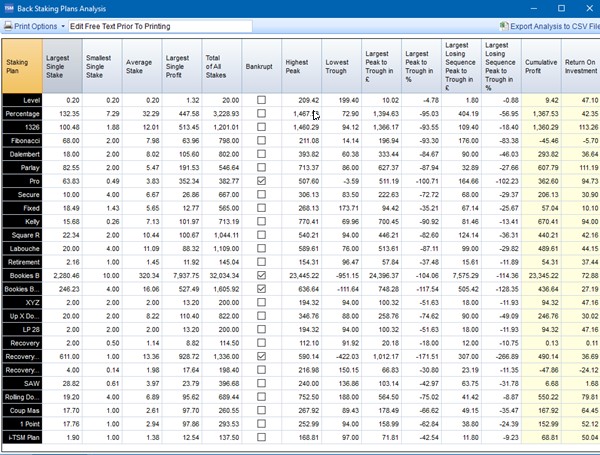
Cumulative Profit
The cumulative profit of the staking plan if used with current staking plan settings.
Any start bank is deducted in this figure.
Return On Investment (ROI)
Cumulative Profit / Total Staked (expressed as a percentage)
Note for lay staking plans ROI is calculated by the following method :
Cumulative Profit / Total Liability(expressed as a percentage)
Largest Single Stake
The largest stake you would have had to made with the current staking plans settings as they are.
Smallest Single Stake
The smallest stake you would have had to made with the current staking plans settings as they are.
Average Stake
The average stake you would bet with the current staking plans settings as they are.
Largest Single Profit
The largest single profit you would have made with the current staking plans settings as they are.
Total Of All Stakes
The sum of all stakes placed
Bankrupt
When the check box is checked this is telling you that at some point during the staking plan your stake was larger than your cumulative total.
Highest Peak
The highest point your cumulative bank would have reached using the current staking plan settings.
Lowest Trough
The lowest point your cumulative bank would have reached using the current staking plan settings.
Largest Peak to Trough In £
Highest Peak – Lowest Trough (expressed in monetary value)
Largest Peak to Trough In %
Highest Peak – Lowest Trough (expressed as a percentage)
Longest Losing Sequence Peak to Trough in £
Calculates the amount your bank decreases throughout your longest losing run (expressed in monetary value)
Longest Losing Sequence Peak To Trough in %
Calculates the amount your bank decreases throughout your longest losing run (expressed as a percentage)
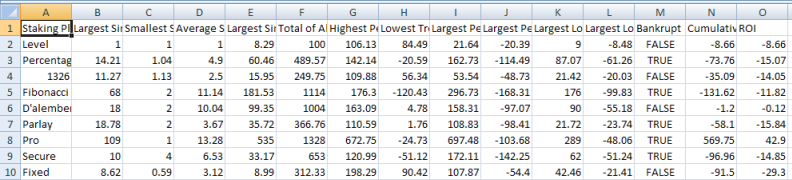
Export Analysis to CSV File
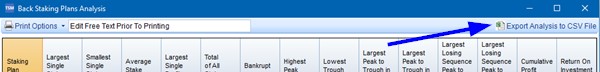
This produces all the data into a CSV file for you. Unformatted and ready for your perusal.