Monte Carlo Test
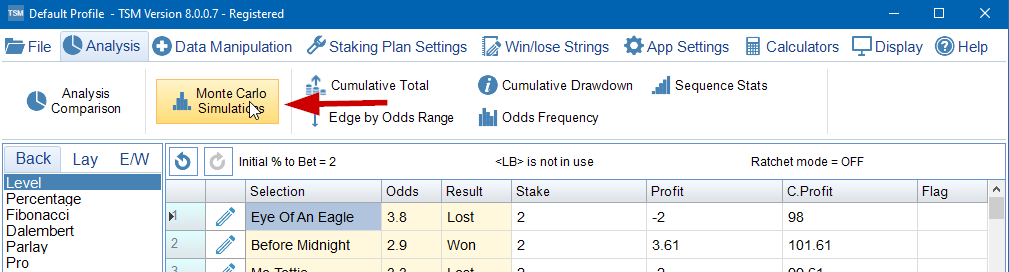
On the main menu select Analysis and then Monte Carlo Simulations.
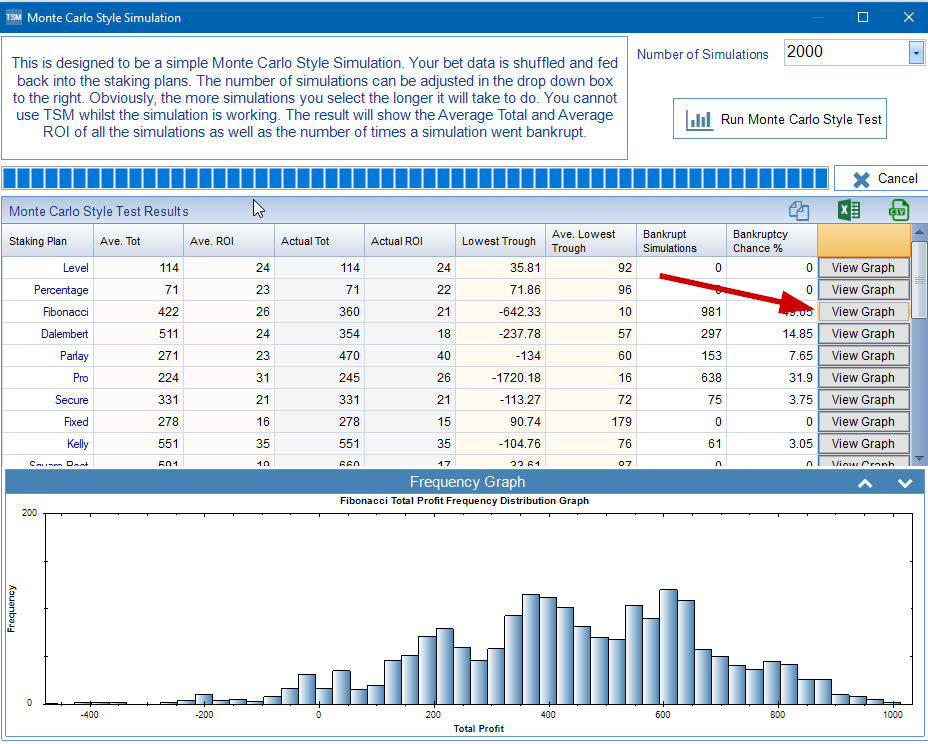
Your bet data can now be shuffled up to 100,000 times. For each shuffle the cumulative total and return on investment for each staking plan is recorded. Whether the bet data order would of caused bankruptcy is also recorded. The result can then be displayed in a frequency distribution graph of cumulative total plotted against frequency. This gives you a fascinating insight into the risk associated with each staking plan.
In the Desktop version of TSM you are limited to 100,000 simulations and 100,000 bets. Beware if you do have a lot of a data, this process can take a long time to run.
Clicking on the View Graph Button produces a frequency distribution graph.