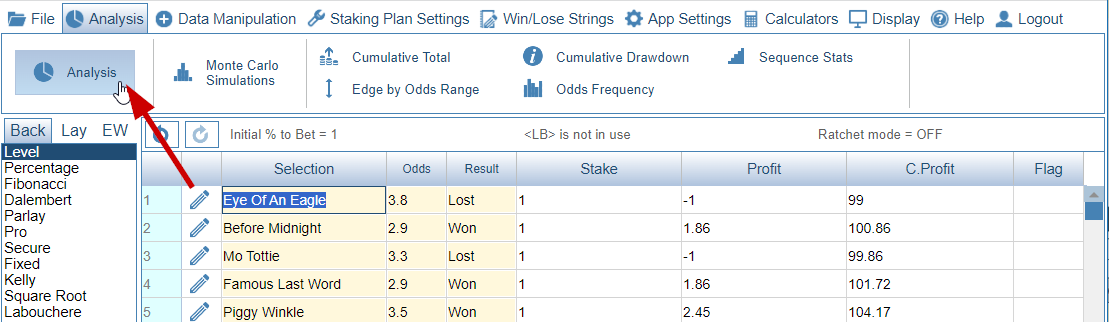
Analysis Screen
Horizontal Menu - Browser Width Greater Than 1100 pixels (Desktop Computer,Laptop, Some Tablets)
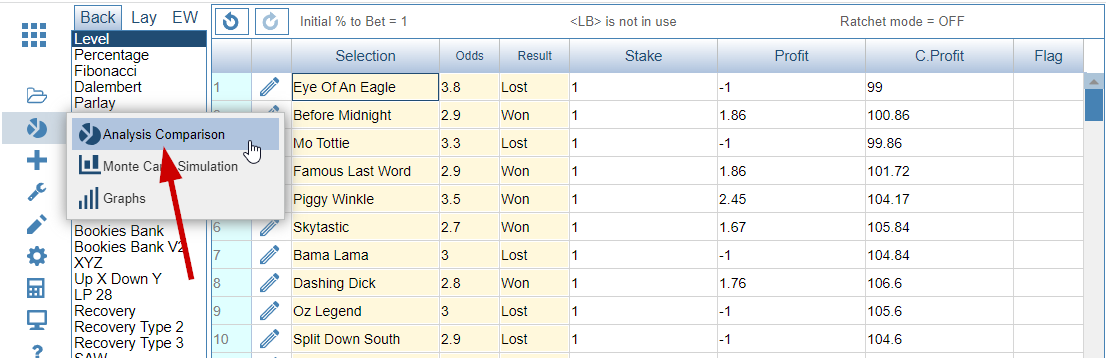
Vertical Menu - Browser Width Less Than 1100 pixels (Some Tablets, Mobile)
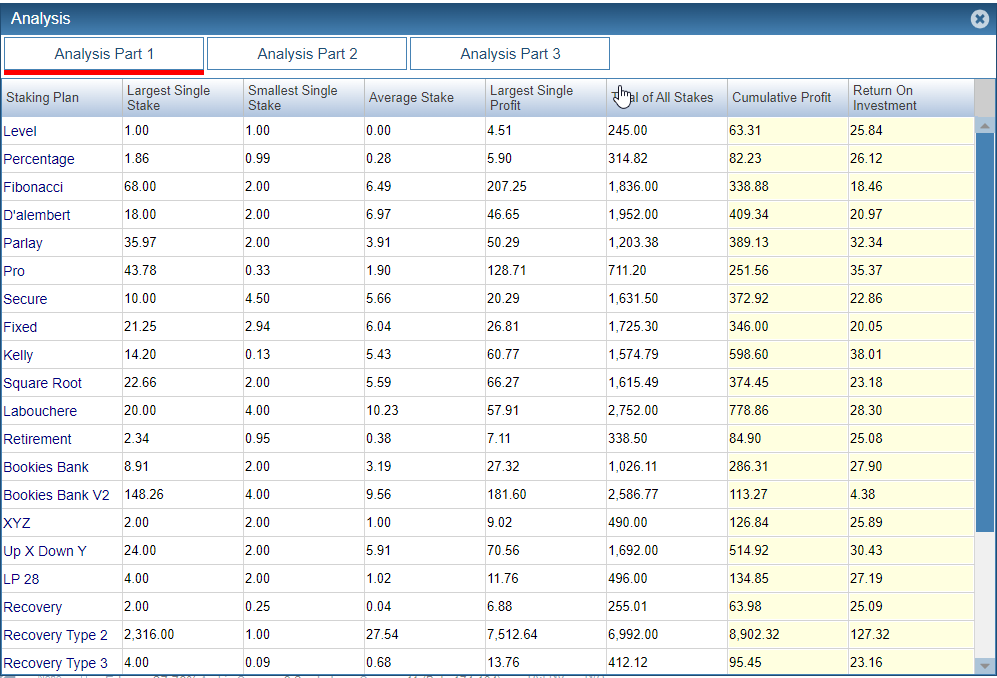
There are several tabs to click through. The cumulative profit and Return on Investment columns always remain visible.
Cumulative Profit
The cumulative profit of the staking plan if used with current staking plan settings. Any start bank is deducted in this figure.
Return On Investment (ROI)
Cumulative Profit / Total Staked (expressed as a percentage)
Note for lay staking plans ROI is calculated by the following method :
Cumulative Profit / Total Liability(expressed as a percentage)
Analysis Part 1
Largest Single Stake
The largest stake you would have had to made with the current staking plans settings as they are.
Smallest Single Stake
The smallest stake you would have had to made with the current staking plans settings as they are.
Average Stake
The average stake you would bet with the current staking plans settings as they are.
Largest Single Profit
The largest single profit you would have made with the current staking plans settings as they are.
Total Of All Stakes
The sum of all stakes placed
Analysis Part 2
Highest Peak
The highest point your cumulative bank would have reached using the current staking plan settings.
Lowest Trough
The lowest point your cumulative bank would have reached using the current staking plan settings.
Analysis Part 3
Largest Peak to Trough In £
Highest Peak – Lowest Trough (expressed in monetary value)
Largest Peak to Trough In %
Highest Peak – Lowest Trough (expressed as a percentage)
Longest Losing Sequence Peak to Trough in £
Calculates the amount your bank decreases throughout your longest losing run (expressed in monetary value)
Longest Losing Sequence Peak To Trough in %
Calculates the amount your bank decreases throughout your longest losing run (expressed as a percentage)