Monte Carlo Test
Horizontal Menu - Browser Width Greater Than 1100 pixels (Desktop Computer,Laptop, Some Tablets)
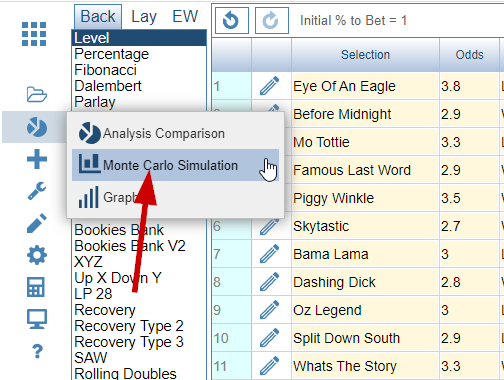
Vertical Menu - Browser Width Less Than 1100 pixels (Some Tablets, Mobile)
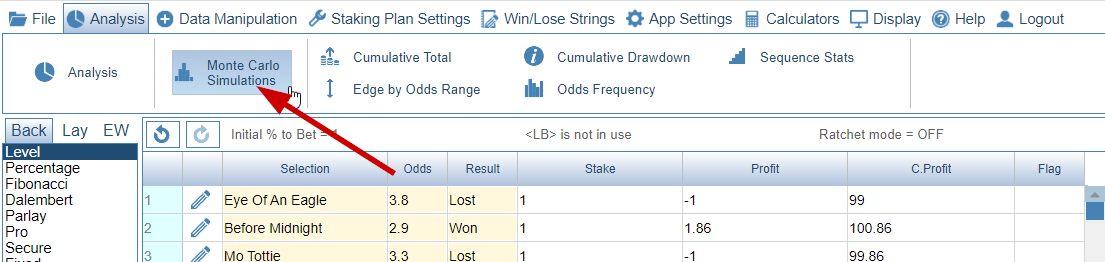
On the main menu select Analysis and then Monte Carlo Simulations.
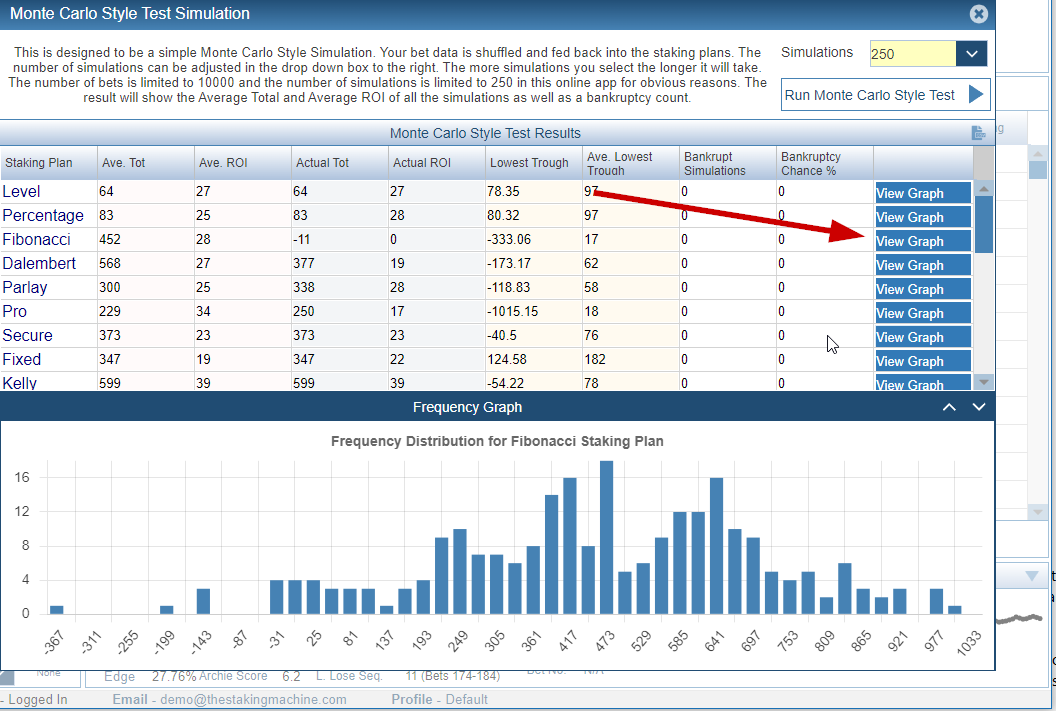
Your bet data can now be shuffled up to 50 times. For each shuffle the cumulative total and return on investment for each staking plan is recorded. Whether the bet data order would of caused bankruptcy is also recorded. The result can then be displayed in a frequency distribution graph of cumulative total plotted against frequency. This gives you a fascinating insight into the risk associated with each staking plan.
In this online version of TSM you are limited to 50 simulations and 1000 bets. If you have more than 1000 bets only the first 1000 bets are used. This limitation is in place to prevent server lock up as the process is extremely CPU intensive. If you want to have up to 100,000 simulations and unlimited bet amount you may need to look at the Desktop Version of TSM.
Clicking on the View Graph Button produces a frequency distribution graph.