Graphs
Horizontal Menu - Browser Width Greater Than 1100 pixels (Desktop Computer,Laptop, Some Tablets)

Vertical Menu - Browser Width Less Than 1100 pixels (Some Tablets, Mobile)
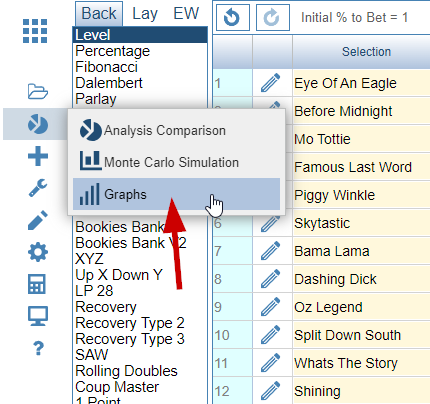
There are currently 6 types of graphs that you can view -
1) Cumulative Total Graph
2) Sequence Stats
3) Frequency of Odds
4) Edge Broken down by Odds Ranges
5) Cumulative Draw Down
6) Moving Strike Rate
Cumulative Total Graph
•Cumulative Total Graph - Graph showing Cumulative Profit against Bet Number. Ability in compare Staking Plans.

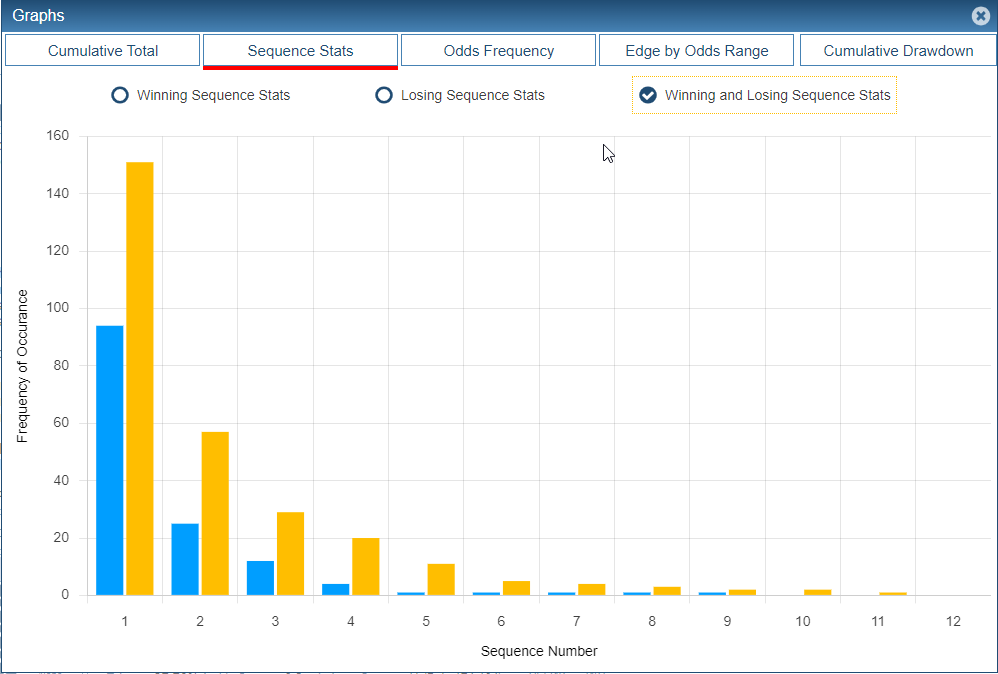
Sequence Stats
•Sequence Stats - Graph showing how often losing and winning sequences occur.
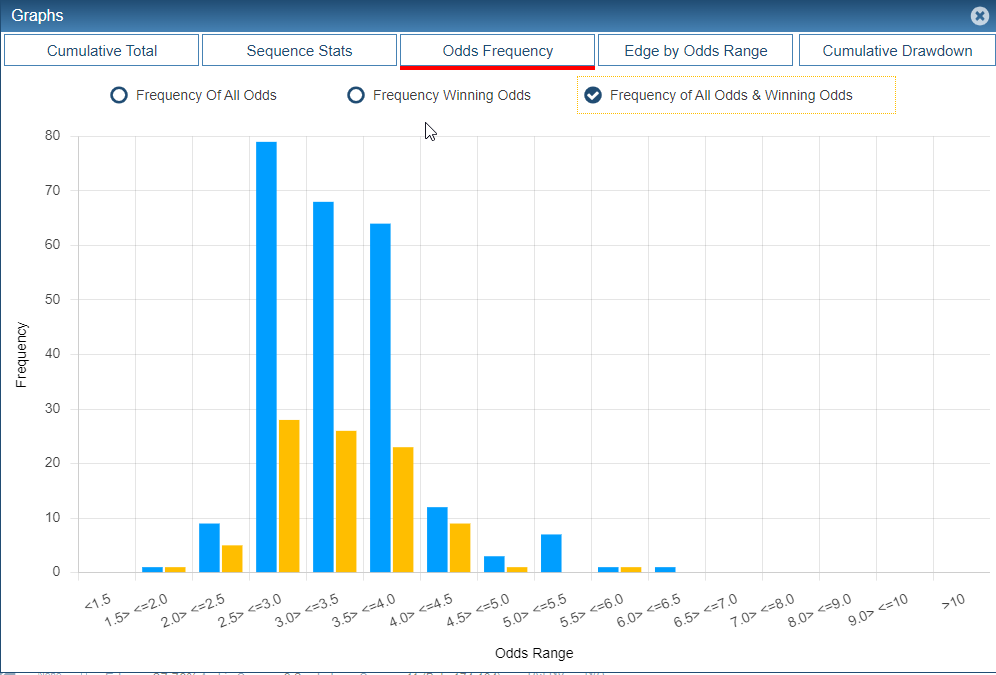
Odds Frequency
•Frequency of Odds - Graph showing frequency of Overall odds/ Winning and losing Odds
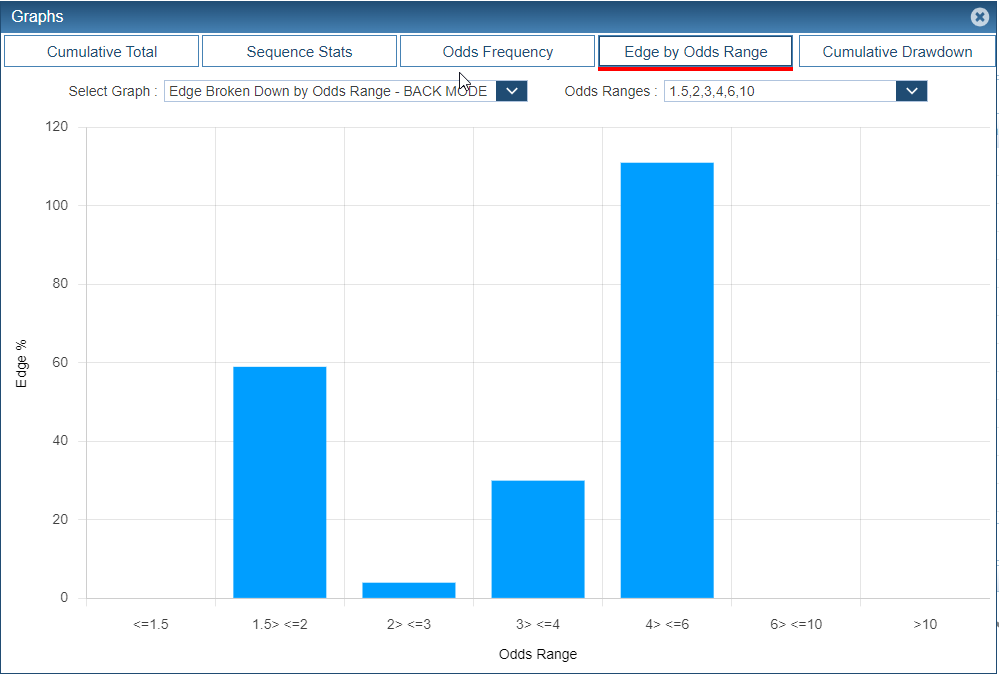
Edge Broken Down by Odds Range
•Edge Broken Down by Odds Range - Graph showing different odds ranges and any edge positive/negative Edge.
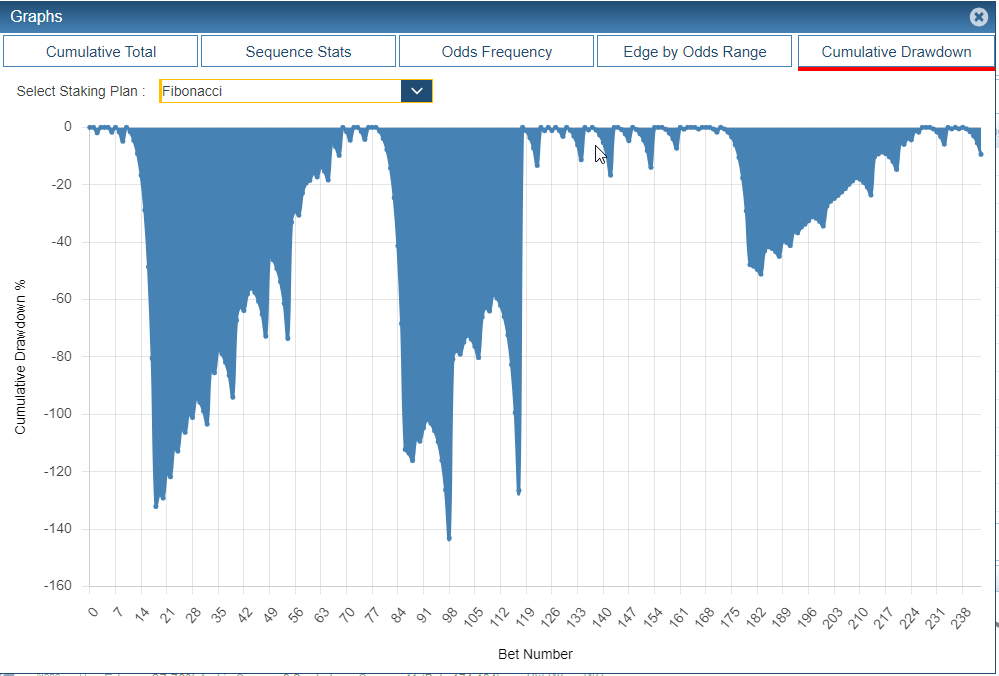
Cumulative Draw down
•Draw Down Graph - This is calculated on a bet by bet basis. The figure is calculated as -
Draw Down = (Cumulative Total - Highest Total Reached So Far) / Highest Total Reached So Far
This is then expressed as a percentage and plotted on the graph.
Moving Strike Rate
•Moving Strike Rate - This shows us how the strike rate changes over the course of time. In the example below we have Strike Rate (ALL) and Strike Rate (Last 100) selected plotted against the Y -Axis on the right hand side. The £1 Stake Cumulative Profit has also been added. This is plotted against the Y - Axis on the left hand side.
