Generate Random Bets
Horizontal Menu - Browser Width Greater Than 1100 pixels (Desktop Computer,Laptop, Some Tablets)
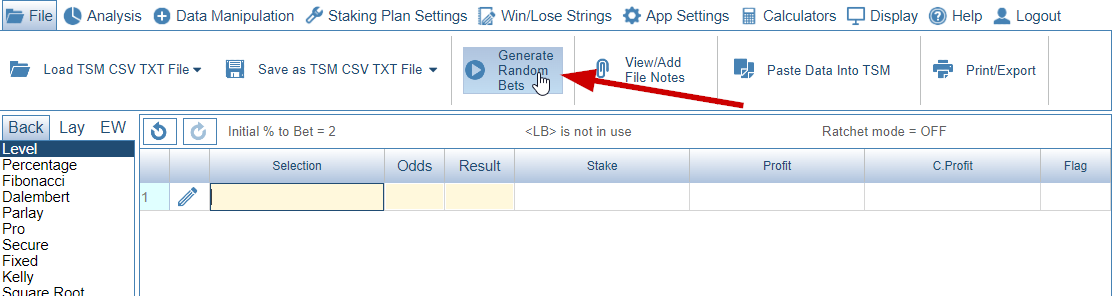
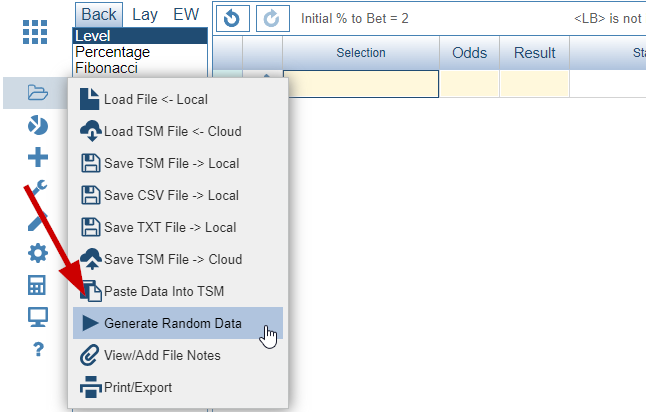
Vertical Menu - Browser Width Less Than 1100 pixels (Some Tablets, Mobile)
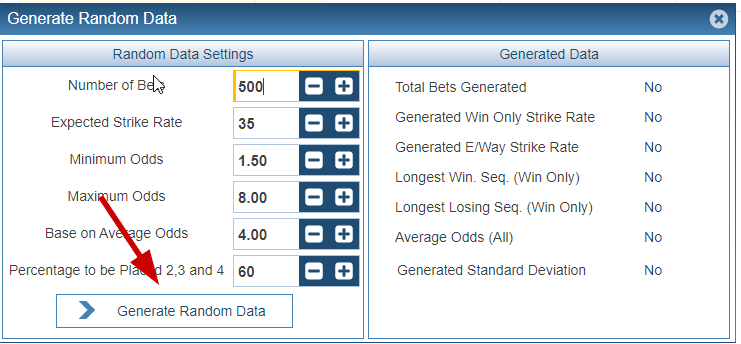
A new screen appears similar to the one below :
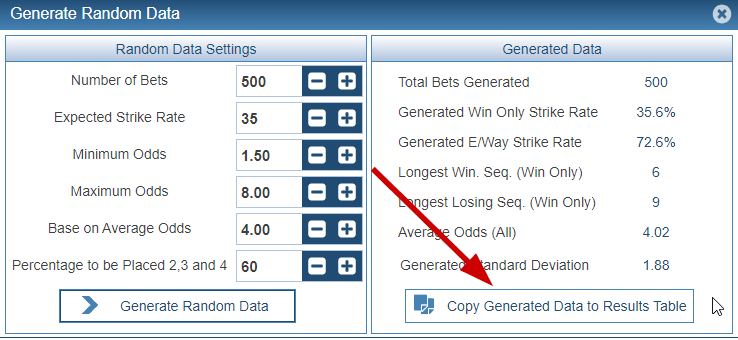
Once you have Generated your data, an option to add the data back to the main grid is shown. You can press 'Generate Random Data' as many times as you wish.
This is a very simple yet powerful feature that you can have a lot of fun with.
Each bet generated is treated individually. For instance if you have set the strike rate as 25% each bet has a 1 in 4 chance of being a win or a '1' as used in The Staking Machine. Therefore total wins will be different each time data is generated.
You can also set your odds ranges. The odds are calculated in the same way as the win/lose calculations - individually - this ensures complete randomness.
You should find that the average odds of your data will closely match the 'base on average odds' setting. You will also find odds varying in the full range you have chosen from 'minimum to maximum' odds.
You can also choose the percentage of non outright winners that will make up position 2,3 or 4. Again each bet is generated on the fly so each outcome is independent of each other.
The number of bets allowed is from 10 to 50000
The Odds Range is from 1 to 100
The Expected Strike Rate is from 1 to 100.
To assist you even further is the 'generated standard deviation' statistic in the bottom right of the screen. The standard deviation is the most common measure of statistical dispersion, measuring how widely spread the values in a data set are. If the data points are close to the mean, then the standard deviation is small. As well, if many data points are far from the mean, then the standard deviation is large. If all the data values are equal, then the standard deviation is zero.