Monte Carlo Simulations
Access Monte Carlo Simulations through the Analysis Tab.
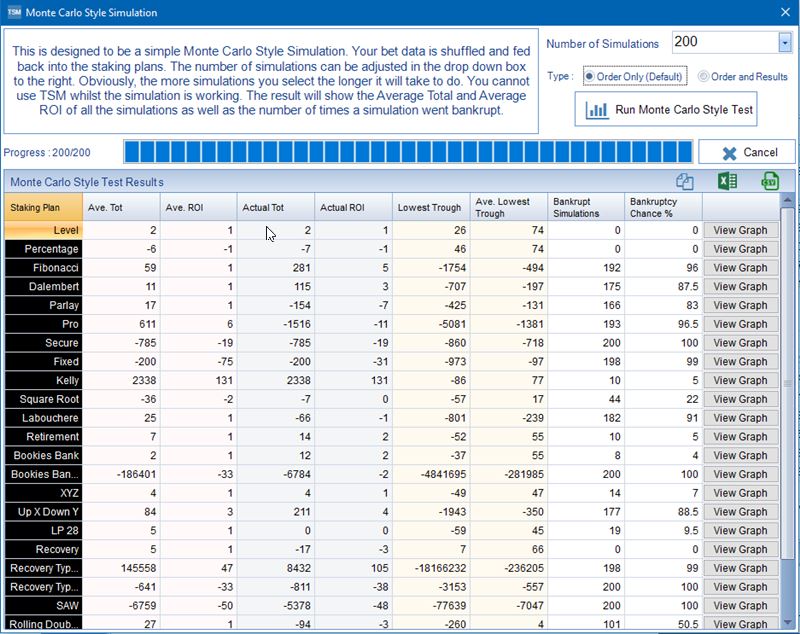
The Monte Carlo Simulations involves shuffling the data and checking the Cumulative Total and Bankruptcy Occurance for each shuffle. This is a great way of looking at the risk level associated with each staking plan. Press the Monte Carlo Simulation Button.

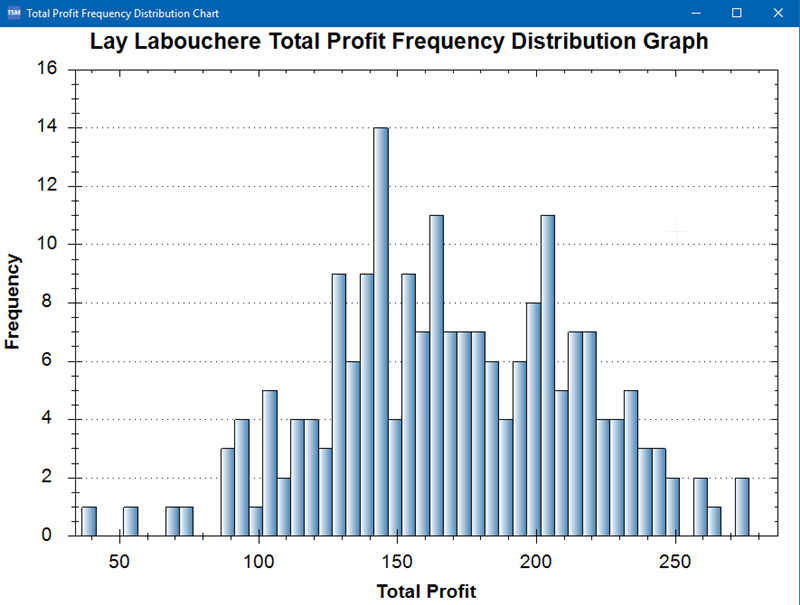
Your bet data can now be shuffled up to 100,000 times. For each shuffle the cumulative total and return on investment for each staking plan is recorded. Whether the bet data order would of caused bankruptcy is also recorded. The result can then be displayed in a frequency distribution graph of cumulative total plotted against frequency. This gives you a fascinating insight into the risk associated with each staking plan.

The Lay Labouchere Graph below shows just how much the order of the bets can affect the end result.

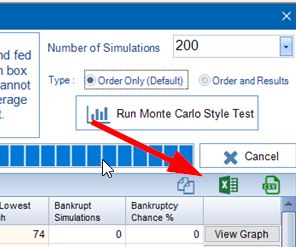
Export Results to EXCEL/CSV File
There is an option to export your results to Clipboard/Excel/CSV on the main Monte Carlo Screen.

