Many statistics and features have been programmed into the software. Once you have added your data into TSM its as easy as clicking a few buttons to run sophisticated reports.
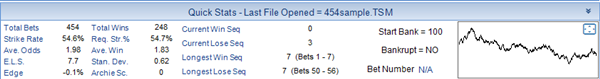
The Quick Stats Panel applies to all staking plans.It is always on show.
The data includes Total Bets, Total Wins, Strike Rate, Required Strike Rate to Break Even, Average Odds, Average winning Odds, Expected Losing Sequence – E.L.S., Standard Deviation of the odds data, Edge and Current Sequence Stats.
There is also individual Staking Plan Analysis available. This includes Return On Investment, Cumulative Profit, Largest Stake, Average Stake, Smallest Stake, Largest Peak to Trough in Monetry Value and as a Percentage.
There are also various Graphs that are available so that the data maybe better understood. There is also a Monte Carlo Simulation Test. This will give you an idea of the risk level associated with each staking plan and give you a percentage chance of bankruptcy if you were to use the staking plan and selection system again.
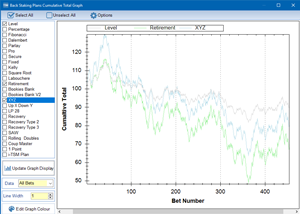
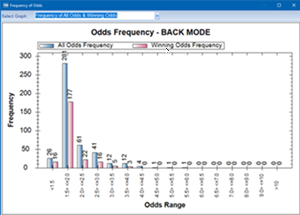
There are also various Graphs that are available so that the data maybe better understood. The Cumulative Profit and Odds Frequency Thumbnails are shown below.