
Data Analysis in TSM
TSM provides everything you need to understand, refine, and optimise your betting strategy. By offering detailed insights into every aspect of your performance, TSM turns data into a powerful weapon in your betting arsenal.
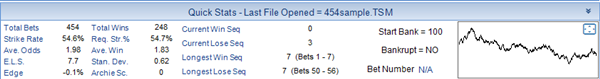
Quick Stats – The Quick Stats panel is found on the main screen. This provides stats that are staking plan independent. They do not change irrespetive of what staking plan is selected.
- Total Bets & Wins: Keep tabs on how many bets you’ve placed and your success rate.
- Strike Rate & Required Strike Rate: Measure your win rate and know the rate needed to break even.
- Edge & ROI (Return on Investment): Discover your advantage over the market and evaluate your profitability.
- Average & Winning Odds: Understand the odds you typically bet on and succeed with.
- Expected Losing Sequence (E.L.S.): Plan for losing streaks to manage your bankroll effectively.
- Standard Deviation: Analyse the variability in your odds data to gauge consistency.
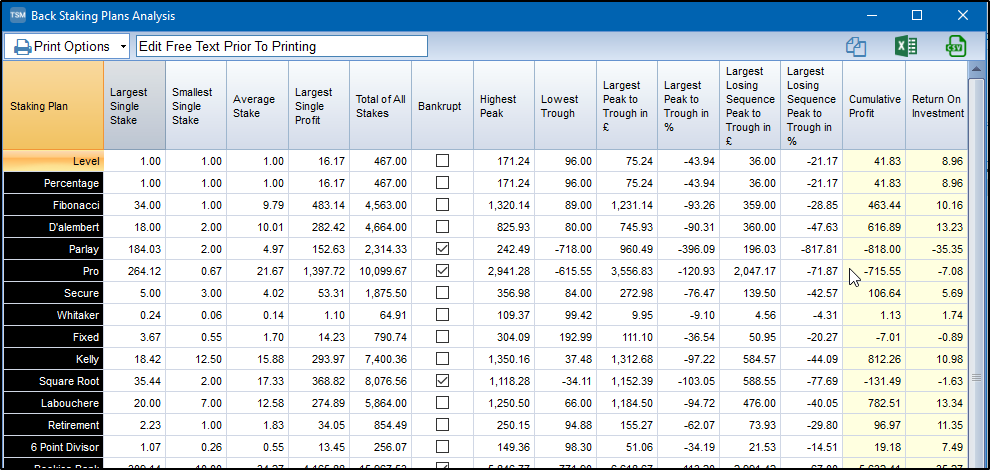
Staking Plan Analysis
If we want to compare Staking Plans we can use the Staking Plan Analysis Screen. This includes data such as largest and smallest stake. Average stake, largest profit, total of all stakes, bankruptcy, various peak to troughs as well as the cumulative profit and return on investment (ROI) for each staking plan.
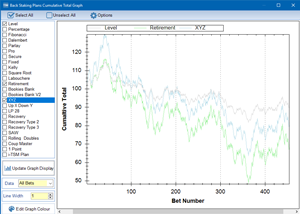
Graphs
TSM doesn’t just crunch numbers—it makes them actionable with clear and intuitive graphical representations:
- Cumulative Profit Graphs: Visualise your long-term performance.
- Edge by Odds Range: Identify trends in the odds you bet on.
- Cumulative Drawdown: Identify instantly which staking plans put you most at bankrupcty risk.
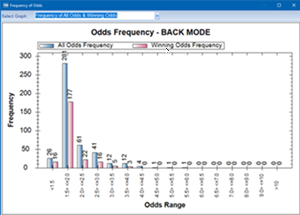
- Odds Frequency: Visual representation of the winning and losing bet odds.
- Sequence Stats: Identify the winning and losing sequence stats. Extremely useful for any staking plan which has a stop loss.
- Moving Strike Rate: Has your selection system gone south? How does the strike rate vary over time?
Assess Risk with Monte Carlo Simulations
Wondering how robust your strategy is? The Monte Carlo Simulation Tool in TSM runs thousands of random simulations on your betting data to:
- Reveal the likelihood of various outcomes.
- Highlight potential risks, including the probability of bankruptcy.
- Provide a frequency distribution graph for informed decision-making.
With Monte Carlo simulations, you can prepare for the unexpected and confidently manage risk, knowing you’ve accounted for every possibility.