
The Importance of Shuffling Data when Researching Selection Systems
Scenario – You have imported your historical data. It shows a profit to Level Stakes. You start exploring alternative staking plans. As you review them, you notice the Fibonacci Staking Plan gives you a huge profit.
On closer inspection you see a large spike in profit halfway through your data. How do you know whether it was sheer luck that created this profit? A winning bet at good odds just happened to fall on a larger stake within the Fibonacci sequence.
For any sequence-based staking plan this is a common problem.
Solution – Shuffle the data. You should instantly be able to see whether the profit was genuine or simply luck.
The Monte Carlo Simulation shuffles your data thousands of times, but sometimes you only need one shuffle to see that your results were a complete fluke.
Example – Using the built-in System Builder (Selection Hunter), I have imported all favourites from 2nd December 2025.
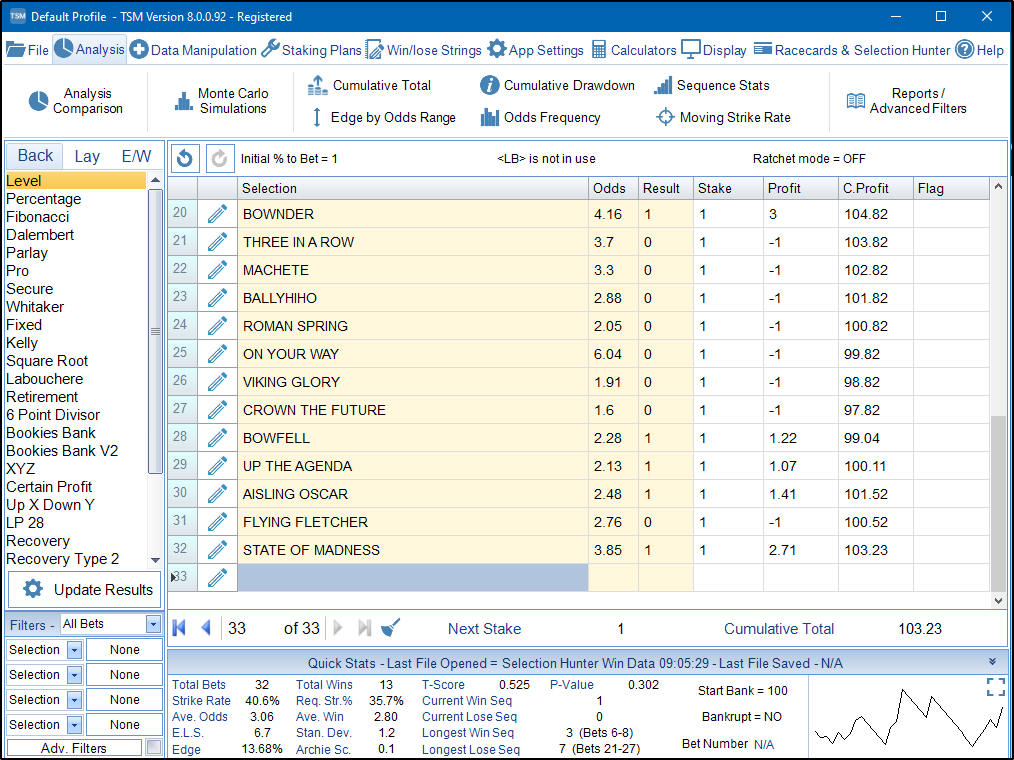
At Level Stakes it shows a profit of £3. A positive edge of almost 14%.
Let’s switch to Fibonacci Staking Plan.
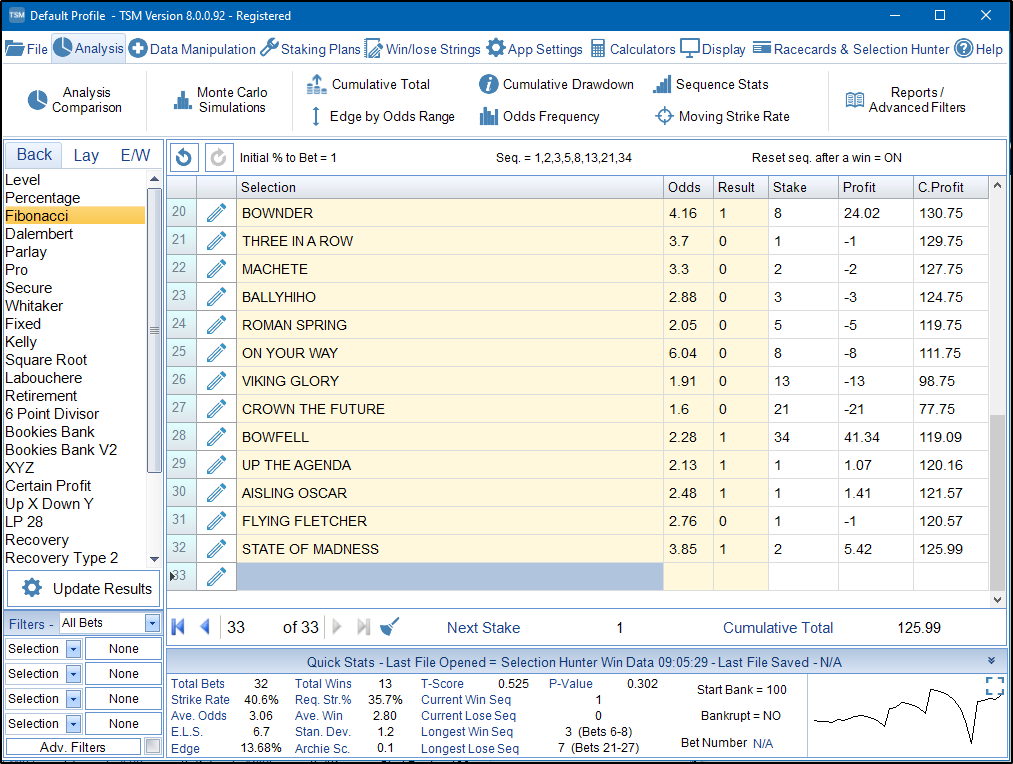
Using a basic Fibonacci sequence starting with a £1 stake and resetting after a win, we end up £26 in profit.
Look at bet 28 though: a £34 stake with a £41 profit.
Now let’s shuffle the data.
Data Manipulation Tab → Shuffle Data
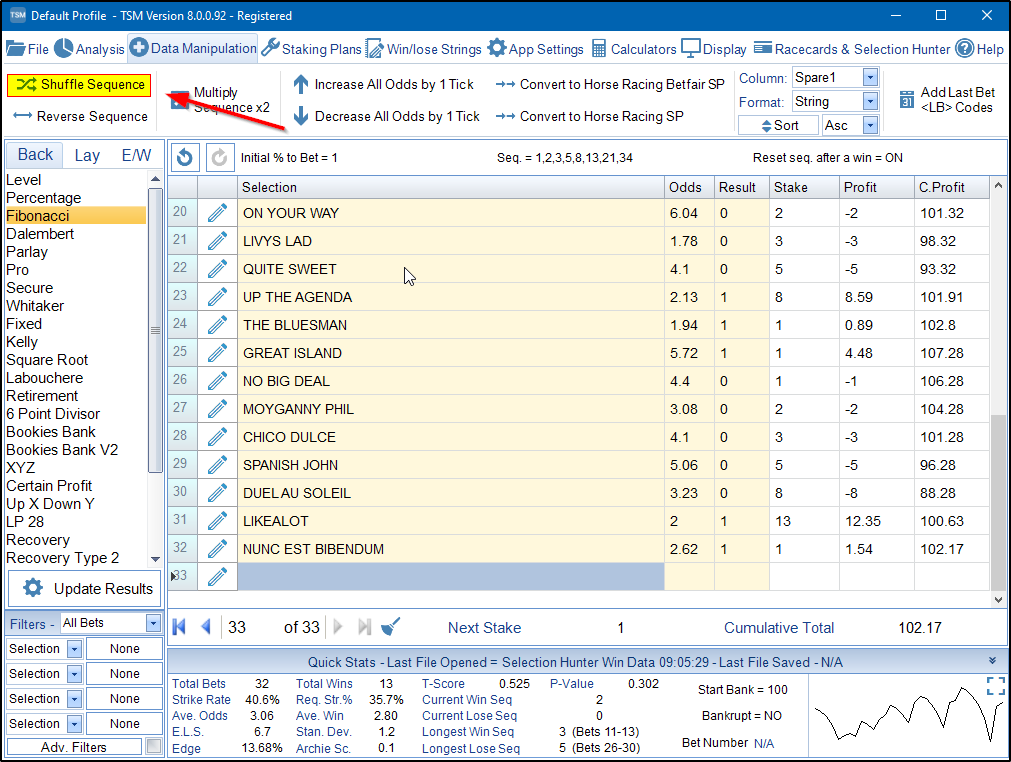
The first shuffle shows a very different set of results. This time it shows only £2 profit, which is lower than Level Stakes.
If you are worried about losing your original data, you can always use the Undo button to return to where you were. You can also sort by Date IF you have included date data in either the Spare 1 or Spare 2 column. (Sorting by Date is also found on the Data Manipulation tab.)
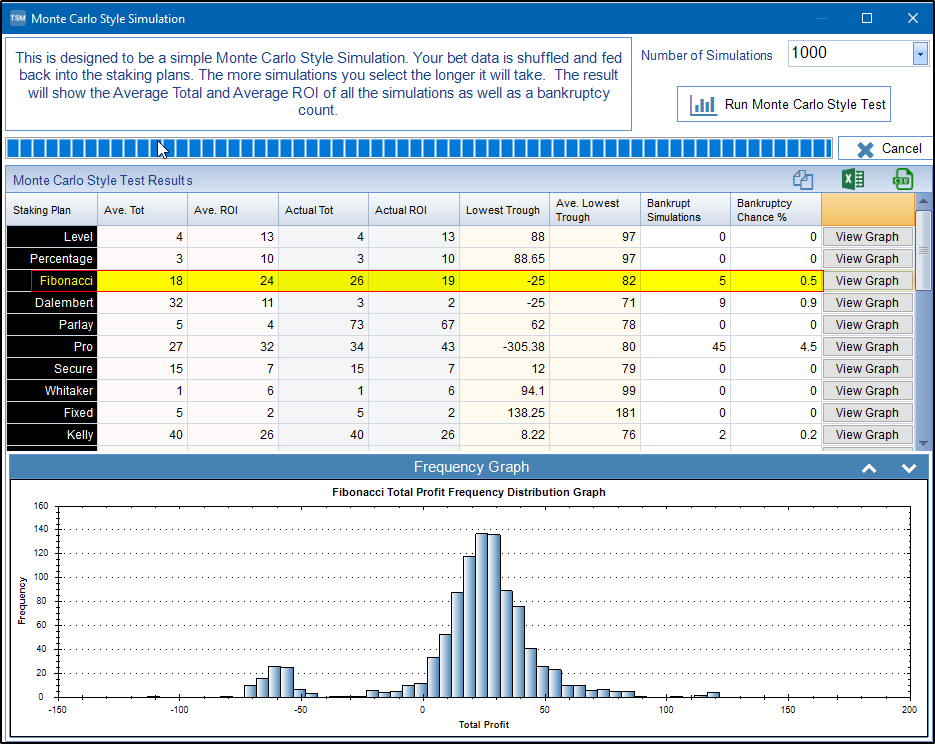
This confirms that the order of the bets can play a massive part in your profits. Let’s put our data through the Monte Carlo Simulation whilst we are here.
Out of 1,000 shuffles, 5 resulted in bankruptcy. This occurs when the next stake is greater than all remaining funds in the betting bank (£100 in our example). From the Frequency Distribution graph we see that the average profit was around £30, but the largest loss was –£111.
Clearly, one day of favourites data is not enough for any meaningful research, but it highlights the importance of shuffling data and doing proper research before using any kind of sequence-based staking plan. The same applies to recovery staking plans as well.